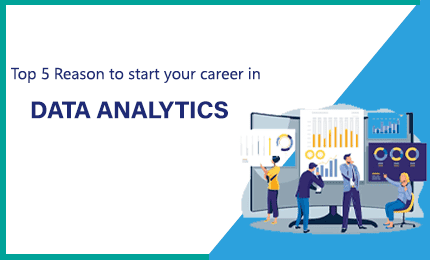
DATA ANALYTICS
Best Institute For Data Analytics In Pune And Pimpri Chinchwad - Become A Certified Data Analyst
Course Path
-
Database SQL
-
Advanced Excel
-
Power BI
-
Tableau
-
Python programming
-
Projects
Course Completion Certifaction
15214
Students Enrolled
4.8
Google Reviews
Guaranteed
Job Interviews
6 Months
Duration
250+ Hours
of Learning

Discover the Top Data Analytics Course in Pune, meticulously designed to offer unparalleled expertise in the domain of data analytics. Our curriculum, set apart by its practical and hands-on approach, offers in-depth training in core data analytics concepts and techniques.
As Pune’s leading Data Analytics Training Center, we equip our students with essential skills using industry-leading tools and methodologies, ensuring they stand out in the job market. Whether you’re a beginner looking to start your journey or a professional aiming to upgrade your skills, our Data Analytics Classes in Pune promise to provide a comprehensive learning experience.
Dive deep into the world of data, learn from experienced professionals, and achieve an Analytics Certification in Pune that’s recognized across leading industries and firms.
What is Data Analytics Course?
Data analytics is the process of examining, cleaning, transforming, and interpreting data to discover meaningful insights, inform conclusions, and support decision-making. A data analytics course, therefore, is a structured educational program that equips learners with the knowledge and skills necessary to analyze and interpret data in various contexts.
Core Components of a Data Analytics Course:
- Introduction to Data & Analytics: Understand what data analytics is, its importance, and its applications across industries.
- Data Collection & Storage: Learn about different data sources, collection methods, and how to store data efficiently using databases and data warehouses.
- Data Cleaning & Pre-processing: Understand the importance of data quality, and learn techniques to clean, preprocess, and transform data to make it suitable for analysis.
- Statistical Analysis: Get acquainted with statistical methods and tools to interpret data, understand distributions, and derive meaningful insights.
- Data Visualization: Learn how to present data in a visually appealing manner using graphs, charts, and tools like Tableau, PowerBI, and Matplotlib.
- Predictive Analytics: Dive into advanced techniques like regression analysis, clustering, and classification to forecast future trends.
- Tools & Software: Gain hands-on experience with tools like Excel, R, Python, and SQL, which are instrumental in data analytics tasks.
- Case Studies & Real-world Projects: Apply analytical techniques to real-world problems and scenarios to solidify learning and understand practical applications.
Why Choose Our Data Analytics Course?
Explore the unique features and benefits of our course that set us apart from other institutes and makes us Pune’s preferred choice for data analytics training.
- Expert-Led Training Session – Learn from the industry’s best with sessions helmed by experienced data analysts who bring real-world insights into the classroom.
- Practical, Hands-On Approach – Dive deep into analytics with real-time projects, hands-on exercises, and practical sessions that ensure you’re job-ready from day one.
- Industry-Recognized Certification – Boost your resume with our certification, recognized by top industry players, ensuring your skills are in line with current industry standards
- Placement & Internship – Internship certificate will be provided along with placement assurance
Who can do Data Analytics Course?
Actually, if we talk about criteria there are no such criteria to do Data Analytics course. Anyone who is willing to learn can do Data Analytics classes in Pimpri- Chinchwad.
- Fresher’s BE/ Bsc Candidate
- Any Engineers
- Any Graduate
- Any Post-Graduate
- Working Professionals
- Professionals from KPO,BPO, Tech Support, Back Office.
Our Alumni Works at


Mode of Batches Schedule for Data Analytics Training Course in Pune
Fast Track Batch
- Session: 4 Hrs per day + Practical
- Duration: 1.5 Months
- Certification: Yes
- Training Type: Classroom
- Study Material: Latest Book
- Days: Monday to Friday
- Practical & Labs: Regular
- Personal Grooming: Flexible Time
Regular Batch
- Session: 1.5 Hrs per day
- Duration: 2 Months
- Certification: Yes
- Training Type: Classroom
- Study Material: Latest Book
- Days: Monday to Friday
- Practical & Labs: Regular
- Personal Grooming: Flexible Time
Weekend Batch
- Session: 2.5 Hrs per day
- Duration: 2.5 Months
- Certification: Yes
- Training Type: Classroom
- Study Material: Latest Book
- Days: Saturday & Sunday
- Practical & Labs: As Per Course
- Personal Grooming: Flexible Time
Upcoming Batch Schedule for Course in Pimpri-Chinchwad
| Sr.No | Date | Duration | Batch | Training Type | Time |
|---|---|---|---|---|---|
|
1 |
02-07-2024 |
3 - 6 Months |
Regular (Mon-Sat) |
Online/Offline |
10-1Pm / 11:30-2:30Pm / 1-4Pm
|
|
2 |
09-07-2024 |
3 - 6 Months |
Regular (Mon-Sat) |
Online/Offline |
10-1Pm / 11:30-2:30Pm / 1-4Pm
|
|
3 |
16-07-2024 |
3 - 6 Months |
Regular (Mon-Sat) |
Online/Offline |
10-1Pm / 11:30-2:30Pm / 1-4Pm
|
|
4 |
23-07-2024 |
3 - 6 Months |
Regular (Mon-Sat) |
Online/Offline |
10-1Pm / 11:30-2:30Pm / 1-4Pm
|
|
5 |
30-07-2024 |
3 - 6 Months |
Regular (Mon-Sat) |
Online/Offline |
10-1Pm / 11:30-2:30Pm / 1-4Pm
|
key feature of our Data Analytics classes in Pimpri- Chinchwad is as below
100 % Placement Assistance
Resume Preparation
Interview Preparation
Multiple Flexible Batches
Practice Course Material
Hands on Experience on One Live Project.
Trainer Profile of Data Analytics Course in Pimpri- Chinchwad
Our Trainers provide complete freedom to the students, to explore the subject and learn based on real-time examples. Our trainers help the candidates in completing their projects and even prepare them for interview questions and answers. Candidates are free to ask any questions at any time.
-
More than 10+ Years of Experience.
-
Trained more than 2000+ students in a year.
-
Strong Theoretical & Practical Knowledge.
-
Certified Professionals with High Grade.
-
Well connected with Hiring HRs in multinational companies.
-
Expert level Subject Knowledge and fully up-to-date on real-world industry applications.
-
Trainers have Experienced on multiple real-time projects in their Industries.
Career Opportunities
Job Market for Data Analytics in Future
Countries like India, China, and Brazil are seeing rapid digitization, leading to an increased demand for data analysts. In India alone, NASSCOM reported that the country would need over 200,000 data analytics professionals by 2025.
Where a professional can get a Job

Data Analyst

Machine Learning Engineer

Business Analyst
Data Analytics Consultant

Financial Analyst

Data Visualization Specialist

Data Engineer
Quantitative Analyst
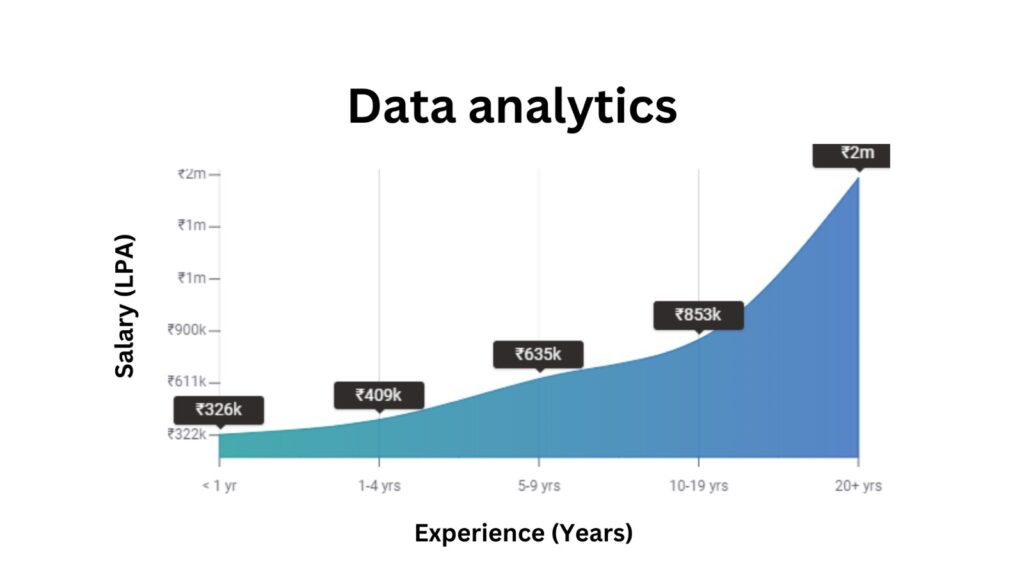
Career Progression and Salary Trends
Course Completion Certificate
Syllabus Of Data Analytics Course in Pune
Introduction to MySQL. Installation of MySQL server. Download sample database .Load sample database to work
Module 2:
Writing Basic SQL
Basic SELECT Statement
Selecting All Columns
Selecting Specic Columns
Writing SQL Statements
Column Heading Defaults
Arithmetic Expressions
Using Arithmetic Operators
Operator Precedence
Using Parentheses
Dening a Null
Dening a Column Alias
Using Column Aliases
Concatenation Operator
Using the Concatenation Operator
Literal Character Strings
Using Literal Character Strings
Duplicate Rows
Eliminating Duplicate Rows
Module 3:
Restricting and Sorting Data
Limiting Rows Using a Selection
Limiting the Rows Selected
Using the WHERE Clause
Character Strings and Dates
Comparison Conditions
Using Comparison Conditions
Other Comparison Conditions
Using the BETWEEN Condition
Using the IN Condition
Using the LIKE Condition
Using the NULL Conditions
Logical Conditions
Using the AND Operator
Using the OR Operator
Using the NOT Operator
Rules of Precedence
ORDER BY Clause
Sorting in Descending Order
Sorting by Column Alias
Sorting by Multiple Columns
Module 4:
Working on DDL Commands
Relational Database Management System (RDBMS)
Normalization
Create Database objects
Data Types in SQL
Alter Table Statements
Drop Table Statements
Various Constraints
Creating Views
Module 5:
Working on DML statements
Data Manipulation Language
Adding a New Row to a Table
The INSERT Statement Syntax 8-5
Inserting New Rows
Inserting Rows with Null Values
Inserting Special Values
Inserting Specic Date Values
Creating a Script
Copying Rows from Another Table
Changing Data in a Table
The UPDATE Statement Syntax
Updating Rows in a Table
Updating Two Columns with a Subquery
Updating Rows Based on Another Table
Updating Rows: Integrity Constraint Error
Removing a Row from a Table
The DELETE Statement
Deleting Rows from a Table
Deleting Rows Based on Another Table
Deleting Rows: Integrity Constraint Error
Using a Subquery in an INSERT Statement
Module 6:
Working on multiple tables and Retrieve records from multiple tables
Self-Join
Inner Join
Left Join
Right Join
Cross Join
Module 7:
Working on multiple tables and Retrieve records from multiple tables
Self-Join
Inner Join
Left Join
Right Join
Cross Join
Module 8:
Working on multiple tables and Retrieve records from multiple tables
Self-Join
Inner Join
Left Join
Right Join
Cross Join
Module 9:
Working on subqueries
Using a Subquery to Solve a Problem
Subquery Syntax
Using a Subquery
Guidelines for Using Subqueries
Types of Subqueries
Single-Row Subqueries
Executing Single-Row Subqueries
Using Group Functions in a Subquery
The HAVING Clause with Subqueries
Multiple-Row Subqueries
Using the ANY Operator in Multiple-Row Subqueries
Using the ALL Operator in Multiple-Row Subqueries
Null Values in a Subquery
Module 10:
Use of built-in function in SQL
Conversion Function
Logical Functions
Math Function
Aggregate Functions
String Functions
Date Functions
Introduction to Data warehouse
Data warehouse Tools
What is Power BI?
Power BI – Flow of Activity
Building Blocks of Power BI
Power BI – Primary Tools : Power Pivot, Power Query,
Power View, Power Map, Power Q&A, Power BI Desktop
Power BI Desktop – Install
Data Sources and Connections
Connect to Data in Power BI Desktop
How to use Query Editor in Power BI
Advanced Data Changes and Transformation
Views in Power BI Desktop
Modeling Data - Manage Data Relationship,
Create Calculated Columns, Optimize Data Models
What is DAX?
Data Types in DAX
Calculation Types
DAX Functions : Date and Time, Time IIntelligence,
Information, Logical, Mathematical, Statistical, Text,
Aggregate Measures in DAX
Table Relationships and DAX
Why Data Visualization
Practices for Data Visualization
How to use Visual in Power BI
Reports in Power BI
Charts in Power BI (Scatter, Waterfall, Funnel)
Slicers
Map Visualizations
Gauges and Single Number Cards
What Are Custom Visuals?
Ofce Store
Downloading Custom Visuals
Importing Custom Visuals in Power BI Report
KPI Visuals
Data Binding in Power BI
Power BI Integration page And Administration
Data Gateways
Content packs
Power BI Report Server
Power BI Embedded
Power BI Embedded Conceptual Model
Workspace Collection
Adding Power BI content to a Workspace
Application Authentication Tokens
Parts of Power BI embedded - REST API
Power BI Embedding without an Embed Token
Power BI Embedding with an Embed Token
Power BI Q&A
Dashboard vs Reports
Creating a Dashboard
Dashboard Tiles
Pinning Tiles
Quick Insights with Power BI
Power BI Publisher for Excel
Overview of Tableau
Data visualization and analytics
Elements of the Tableau dashboard
Understanding the signicance of Tableau Desktop and Tableau Server
Extensively work with data visualization using line, bar, area,
stacked bar, and multi line charts
Connecting with Excel data
Various data representation techniques
Like Tables
Graphs and Maps understanding the basics of Tree Map
Histogram
Filled Map
Symbol Map
Pie Chart
Trend Lines
Normal Tables and Multi measure Tables
Understanding the conditions and methodology for joining Tables
Knowledge of Multi Table Joins
Working with Table
Creation of Calculated Fields
Duplicating and renaming columns
Conversion of data types
Default aggregation
Tableau Hierarchy creation
Static Group creation
Deploying functions for Group creation
The various options of Sorting in Tableau
Sorting of Multi-dimensional graph
Deploying combined fields and setting sorting priorities
Working with Dual Line Charts
Multiline Chart
Donut Chart
Pie Chart
Working with Measure Name and Measure Values
Learning about the different type of Single Axis Histogram,
Dual Axis Histogram
Learning about the different type of Single Axis Histogram
Dual Axis Histogram
Understanding how to design and work with Pareto Chart
Deploying Motion Chart for data that changes over time using x and y axes
Representation of numerical data through quartiles using Box Plot
Deploying the Exclude function in LOD
Introduction to R Statistical computing
The various applications and use cases of R
Deploying R on the Tableau platform
Learning the R functions in Tableau
The concept of Outliers in Tableau
Learning how to deploy K-means clustering in order to group and parse data in Tableau.
Tableau StoryTelling
The art of telling stories with Tableau, the importance of story point and determining when to deploy Tableau Storytelling
Converting the data available on a Graph into a Visual Storytelling endeavour
Working with Funnel Chart for data that progressively reduces with each stage.
Deploying Waterfall Chart for understanding the cumulative effect of sequential values
Understanding the concept of Set which is an entity whose composition is based on a computed condition
Learning how to perform various operations on Strings like concatenation Manipulation and analyzing with String Calculated Fields
Working with Date Calculated Fields for performing operations like parsing Modifying and analyzing
Learning to use the dynamic values or parameters including
What if Analysis Column Selection Parameters,
Chart Selection Parameters
Tableau lets you add interactivity and context to your data using Filter Actions, URL Actions.
Working with the Tableau Dashboard and understanding the various concepts like Formatting, Containers, Navigations and Actions.
Understanding the basic Architecture of Tableau
Learning about Tableau Desktop features,Tableu Server,
working of Tableau and the various Tableau Products
Tableau Products
Tableau public Features
Tableau Desktop personal features
Tableau Desktop professional feature
Tableau Server Feature
Tableau File System
Tableau Working
Tableau Server Architecture
Tableau Connections –Live Connection and Data Extract Connection,
Comparing the two Live And Extract connection
Learning to work on Tableau by sharing the dashboard with offline users
Methods to work with data from disparate sources,
denning the relationship between the data and combining it in the optimal way.
Working with various Tableau Filter options, understanding the Filter Dimensions and ways to make the Filter Global.
Taking the various data sources and implementing to blend the graphs, using Global Fliter for blending graphs
Tableau Level of Detail Expressions for combining aggregate and non-aggregate data, converting aggregate to non-aggregate data in Tableau 9.X
Integrating MapBox on Tableau for deploying Maps into Tableau Visualization
Understanding Tableau Table Calculation, familiarizing with Graph and View, learning about Context lter
Understanding the concept of aggregating data in Tableau, dening Table Calculation, , Mark Labels, FORMAT function, working with String, Date and Logical Function, data disaggregating, forecasting.
Dening Table Calculation
Working with Drop Lines
Mark Labels
FORMAT function
Working with String
Date and Logical Function
Data disaggregating
Forecasting
Create clustering
Understanding how it works for scatter plots,
text tables and maps, creation of custom territories, mastering the art of advanced bar charts in Tableau 10
Understanding the various Tableau 10 features like Highlighter, deploying multiple data sources for creation of lter and advanced mapping functionalities.
Introduction to the various new features of Tableau 10, working with Device Designer, New Device Interface, Color palette and more
Beautify by design in Tableau 10
Beautify by design in Tableau 10
Understanding new data breakthrough in Tableau 10, new features of data sources, integrating multiple data sources for deriving insights.
Tableau Project
Excel Introduction
Date And Time Functions
Customizing Excel
File Formats..
Advanced Paste Special Techniques
Using Basic Functions
New In Excel 2013 / 2016 & 365
Formatting And Proofing
New Charts - treemap & Waterfall
Using Power Map And Power View
Quick Analysis Tool
Mathematical Functions
Sorting And Filtering
Various Charts Gantt Chart, Doughnut Chart, Pie, Column & Area Chart
Sorting Data Using Custom Sort
Dashboard Designing
Data Validation, Creating Drop Down Lists Using Different Data Sources
Protecting Excel
Text Functions
Printing Workbooks
What If Analysis
Pivot Tables
Logical Functions
Arrays Functions
Data Validation
Charts And Slicers
Lookup Functions
Smart Lookup And Manage Store
Excel Dashboard
Introduction To Vba
Looping In Vba
Variables In Vba
Mail Functions – Vba
Message Box And Input Box
Worksheet / Workbook Operations
If And Select Statements
Frequently Asked Question on Data Analytics Course
• While the course is beneficial for IT professionals, managers, and researchers, it's designed to be accessible to anyone interested in leveraging the power of data, regardless of their background.
While having a background can be beneficial, most introductory courses are designed to accommodate beginners without any prior experience
The course typically covers tools like Excel, SQL, PowerBI, Tableau, and programming languages like Python or R, depending on the curriculum
Course duration can vary, ranging from a few weeks for basic courses to several months for comprehensive programs
While both fields revolve around data, Data Analytics primarily focuses on inspecting and cleaning data to discover patterns, whereas Data Science encompasses a broader range, including machine learning, predictive modeling, and advanced statistical techniques
Course fees can vary based on factors like course duration, institution reputation, and course depth. It's best to check with specific institutions for precise fee structures.
Sure! Most of our Course Comes with Global Certification for which you have to give Exam at the End of the Course.
Yes we do have different Exam Conducting Department where you can apply for certain course’s Exam