TABLEAU
Tableau classes In Pimpri Chinchwad: Empower Your Career with Data Skills
Enquire Now
15214
Students Enrolled
4.8
Google Reviews
Guaranteed
Job Interviews
6 Months
Duration
250+ Hours
of Learning

Tableau Classes in Pimpri Chinchwad at Analytiq Learning provides an in-depth understanding of the Tableau Desktop Skills. In Analytiq Learning you’ll gain significant insight into knowledge visualization, conditional information, scripting, and organizing and simplifying data.
Further, the course throws lightweight on Tableau Statistics and provides active coaching concerning a way to produce the foremost comprehensive and interactive dashboards.
What is Tableau?
Tableau could be a powerful and quickest growing information visualization tool employed in the Business Intelligence business. It helps in simplifying data into the terribly simply perceivable format.
Data analysis is extremely quick with Tableau and also the visualizations created ar within the type of dashboards and worksheets. The data that’s created exploitation Tableau is often understood by skilled at any level in a corporation. It even permits a non-technical user to make a made-to-order dashboard.
Why Should I take Tableau Training Classes in PCMC?
Reasons why you should learn and invest your time in Tableau:
1. FIRST ULTIMATE SKILL FOR DATA SCIENCE:
Not only is this an ultra-powerful tool for seasoned analysts, but it’s also so easy to learn that is a great entry point into the World of Data.
2. USER-FRIENDLY:
It helps people see and understand data. Tableau products are transforming the way people use data to solve their problems. Tableau makes analyzing information quick and straightforward, stunning and helpful.
3. APPLY TO ANY BUSINESS:
As the wants of various sorts on organizations vary, Tableau provides several choices to require it into use. The future is here. You can use it as a student, organization or as a Data analyst, or even as a journalist.
The data is taken from anyplace and shared at intervals the organization via desktop or mobile browser.
Who can do Tableau Training Course?
Actually, if we talk about criteria there are no such criteria to do Software testing course. Anyone who is willing to learn can do Tableau classes in Pimpri- Chinchwad.
- Fresher’s BE/ Bsc Candidate
- Any Engineers
- Any Graduate
- Any Post-Graduate
- Working Professionals
- Professionals from KPO,BPO, Tech Support, Back Office.
Our Alumni Works at


Batches We Offer for Tableau Training in Pimpri Chinchwad
Fast Track Batch
- Session: 4 Hrs per day + Practical
- Duration: 1.5 Months
- Certification: Yes
- Training Type: Classroom
- Study Material: Latest Book
- Days: Monday to Friday
- Practical & Labs: Regular
- Personal Grooming: Flexible Time
Regular Batch
- Session: 1.5 Hrs per day
- Duration: 2 Months
- Certification: Yes
- Training Type: Classroom
- Study Material: Latest Book
- Days: Monday to Friday
- Practical & Labs: Regular
- Personal Grooming: Flexible Time
Weekend Batch
- Session: 2.5 Hrs per day
- Duration: 2.5 Months
- Certification: Yes
- Training Type: Classroom
- Study Material: Latest Book
- Days: Saturday & Sunday
- Practical & Labs: As Per Course
- Personal Grooming: Flexible Time
Upcoming Batch Schedule for Course in Pimpri-Chinchwad
| Sr.No | Date | Duration | Batch | Training Type | Time |
|---|---|---|---|---|---|
|
1 |
03-12-2024 |
3 – 6 Months |
Regular (Mon-Sat) |
Online/Offline |
10-1Pm / 11:30-2:30Pm / 1-4Pm
|
|
2 |
10-12-2024 |
3 – 6 Months |
Regular (Mon-Sat) |
Online/Offline |
10-1Pm / 11:30-2:30Pm / 1-4Pm
|
|
3 |
17-12-2024 |
3 – 6 Months |
Regular (Mon-Sat) |
Online/Offline |
10-1Pm / 11:30-2:30Pm / 1-4Pm
|
|
4 |
24-12-2024 |
3 – 6 Months |
Regular (Mon-Sat) |
Online/Offline |
10-1Pm / 11:30-2:30Pm / 1-4Pm
|
|
5 |
31-12-2024 |
3 – 6 Months |
Regular (Mon-Sat) |
Online/Offline |
10-1Pm / 11:30-2:30Pm / 1-4Pm
|
key feature of our Tableau Training classes in Pimpri-Chinchwad is as below
100 % Placement Assistance
Resume Preparation
Interview Preparation
Multiple Flexible Batches
Practice Course Material
Hands on Experience on One Live Project.
Trainer Profile of Tableau Course in Pimpri-Chinchwad
Our Trainers provide complete freedom to the students, to explore the subject and learn based on real-time examples. Our trainers help the candidates in completing their projects and even prepare them for interview questions and answers. Candidates are free to ask any questions at any time.
-
More than 10+ Years of Experience.
-
Trained more than 2000+ students in a year.
-
Strong Theoretical & Practical Knowledge.
-
Certified Professionals with High Grade.
-
Well connected with Hiring HRs in multinational companies.
-
Expert level Subject Knowledge and fully up-to-date on real-world industry applications.
-
Trainers have Experienced on multiple real-time projects in their Industries.
Career Opportunities
Freshers/ Professional Job Opening for Tableau Course in pune/PCMC
Due to the easiness and strength of Tableau, many companies are using Tableau to develop websites. Thus there is a huge no. of jobs that are available in Tableau. A person can easily become a full stack web developer using the Tableau framework.
Due to the easiness to understand and use, Django is very famous in the IT industry for website development. Also, Tableau helps us to create websites very fast and meet the deadlines.
We at Analytiq Learning will provide you calls for web developer profiles using Tableau. As this framework is high in demand so lots of opportunities are there.
Where a professional can get a Job

Tableau Developer

VBA Tableau Developer

Tableau Associate

Sr. Analyst - IT Tableau Developer
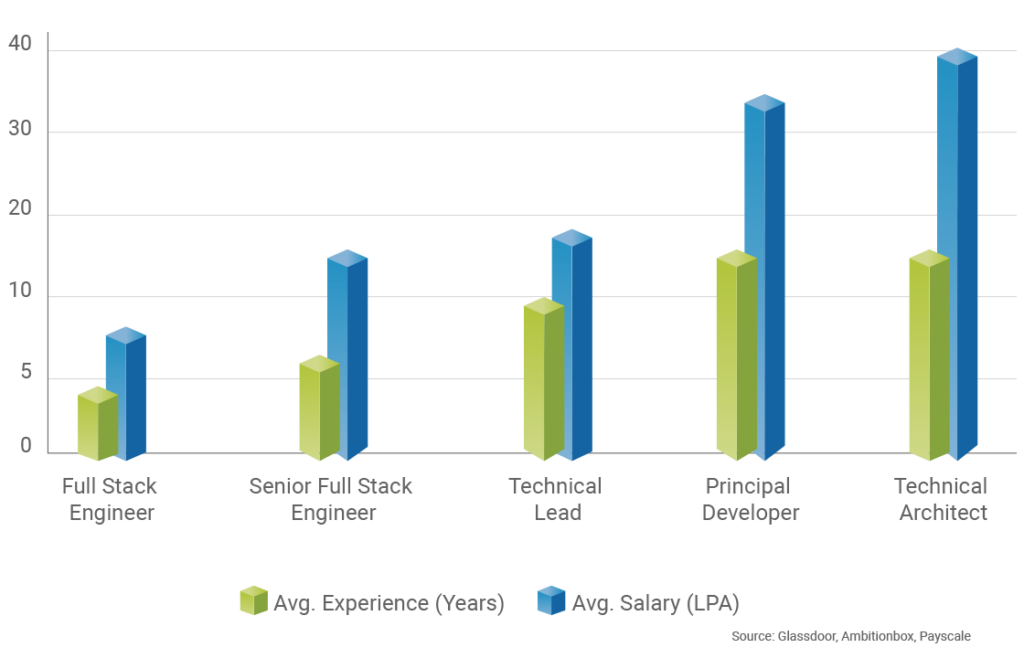
Career Progression and Salary Trends
Course Completion Certificate
Syllabus of Tableau Course in Pimpri Chinchwad
- Overview of Tableau
- Data visualization and analytics
- Elements of the Tableau dashboard
- Understanding the signicance of Tableau Desktop and Tableau Server
- Extensively work with data visualization using line, bar, area,
stacked bar, and multi line charts - Connecting with Excel data
- Various data representation techniques
- Like Tables
- Graphs and Maps understanding the basics of Tree Map
- Histogram
- Filled Map
- Symbol Map
- Pie Chart
- Trend Lines
- Normal Tables and Multi measure Tables
- Understanding the conditions and methodology for joining Tables
- Knowledge of Multi Table Joins
- Working with Table
- Creation of Calculated Fields
- Duplicating and renaming columns
- Conversion of data types
- Default aggregation
- Tableau Hierarchy creation
- Static Group creation
- Deploying functions for Group creation
- The various options of Sorting in Tableau
- Sorting of Multi-dimensional graph
- Deploying combined elds and setting sorting priorities
- Working with Dual Line Charts
- Multiline Chart
- Donut Chart
- Pie Chart
- Working with Measure Name and Measure Values
- Learning about the different type of Single Axis Histogram,
- Dual Axis Histogram
- Learning about the different type of Single Axis Histogram
- Dual Axis Histogram
Understanding how to design and work with Pareto Chart
Deploying Motion Chart for data that changes over time using x and y axes
Representation of numerical data through
quartiles using Box Plot
Working with Funnel Chart for data that progressively reduces with each stage.
Deploying Waterfall Chart for understanding the cumulative
effect of sequential values
Understanding the concept of Set which is an entity whose
composition is based on a computed condition
- Learning how to perform various operations on Strings like
concatenation Manipulation and analyzing with String - Calculated Fields
- Working with Date Calculated Fields for performing operations
like parsing Modifying and analyzing
- Learning to use the dynamic values or parameters including
- What if Analysis Column Selection Parameters,
- Chart Selection Parameters
- Tableau lets you add interactivity and context
to your data using Filter Actions, URL Actions.
- Working with the Tableau Dashboard and
understanding the various concepts like Formatting, - Containers, Navigations and Actions.
- Understanding the basic Architecture of Tableau
- Learning about Tableau Desktop features,Tableu Server,
working of Tableau and the various Tableau Products - Tableau Products
- Tableau public Features
- Tableau Desktop personal features
- Tableau Desktop professional feature
- Tableau Server Feature
- Tableau File System
- Tableau Working
- Tableau Server Architecture
- Tableau Connections –Live Connection and Data Extract Connection,
- Comparing the two Live And Extract connection
Learning to work on Tableau by sharing the dashboard with ofine users
Methods to work with data from disparate sources,
dening the relationship between the data and combining it in
the optimal way.
Working with various Tableau Filter options,
understanding the Filter Dimensions and ways to make
the Filter Global.
Taking the various data sources and implementing
to blend the graphs, using Global Fliter for
blending graphs.
Tableau Level of Detail Expressions for combining
aggregate and non-aggregate data, converting aggregate
to non-aggregate data in Tableau 9.X
- Integrating MapBox on Tableau for deploying Maps into
- Tableau Visualization
- Understanding Tableau Table Calculation, familiarizing with
- Graph and View, learning about Context lter
- Understanding the concept of aggregating data in Tableau,
dening Table Calculation, , Mark Labels, FORMAT function,
working with String, Date and Logical Function,
data disaggregating, forecasting. - Dening Table Calculation
- Working with Drop Lines
- Mark Labels
- FORMAT function
- Working with String
- Date and Logical Function
- Data disaggregating
- Forecasting
LOD Expression Function
- Introduction to R Statistical computing
- The various applications and use cases of R
- Deploying R on the Tableau platform
- Learning the R functions in Tableau
- The concept of Outliers in Tableau
- Learning how to deploy K-means clustering in order to group
and parse data in Tableau.
- The art of telling stories with Tableau, the importance of story
point and determining when to deploy Tableau Storytelling
- Converting the data available on a Graph into a Visual
- Storytelling endeavour
- Create clustering
- Understanding how it works for scatter plots,
text tables and maps, creation of custom territories,
mastering the art of advanced bar charts in Tableau 10
- Understanding the various Tableau 10 features like Highlighter,
deploying multiple data sources for creation of lter and
advanced mapping functionalities.
- Introduction to the various new features of Tableau
10, working with Device Designer, New Device
Interface, Color palette and more - Beautify by design in Tableau 10
- Beautify by design in Tableau 10
- Understanding new data breakthrough in Tableau
10, new features of data sources, integrating
multiple data sources for deriving insights.
Data breakthrough in Tableau 10
Tableau Project
Frequently Asked Question on Tableau Course
All the Courses Are Merged With Placement Assistance
We Are Committed For Lowest Course Fees in the Market
Yes! We do provide Certification straight after completion of the Course
Yes, this Course has heavy Offer discount in fees if you pay in One Shot/ Group Admission
Don’t Worry! We Do Have Flexible Fees Installment Option
Yes! This Course Comes With Live Practical Sessions And Labs
Sure! Most of our Course Comes with Global Certification for which you have to give Exam at the End of the Course
Yes we do have different Exam Conducting Department where you can apply for certain course’s Exam